Welcome to the SuStaIn batch Tool in Neugrid!
 |
This project has received funding from the European Union’s Horizon 2020 research and innovation programme under grant agreement No. 666992. |
This tool allows to characterize a collection of individuals with a subtype and stage based on an Alzheimer’s disease-related brain atrophy model (Archetti et al, 2021)defined by means of Subtype and Stage Inference (SuStaIn) algorithm (see details below).
How to run the analysis
You can either choose to run sustain on freesurfer volumes you already computed or run sustain starting from MRI scans. In case you choose the first option please upload a .csv file containing age, sex and relevant brain volumes computed with freesurfer 5.3 and submit the job (see .csv template here). In case you prefer the second option you have to upload a zip containing T1-weighted 3D MRI scans of all subjects (DICOM or nii.gz)and a .csv file that reports age and sex of all subjects. The zip must contain a list of directories, each one corresponding to a different individual and named in the same way an individual is named in the .csv file. Each subject directory must must contain a subdirectory called “T13D” that contains the dicom/nii.gz files. Please download the example zip file and example csv file for more info. The MRI image will be processed with freesurfer 5.3 and relevant brain volumes will be extracted to assign the subject an atrophy pattern and the relative model stage. A .csv file containing the outputs of the analysis will be sent at the email address you provide below.
|
Csv-based version |
MRI-based version |
SuStaIn (Subtype and Stage Inference) is a novel data-driven approach designed to discover disease subtypes and characterize each subtype by means of a z-score progression mirroring the severity of the biomarker affected by the disease. The SuStaIn model employed for this tool was trained on the basis of brain volumes from subjects from the ADNI data cohort in order to discover Alzheimer’s disease related brain atrophy patterns. The training set was composed by subjects aged 54-90 that were either cognitively normal (CN), affected by mild cognitive impairment (MCI), or by Alzheimer’s disease (AD).The volumes of relevant brain regions were obtained from T1-weighted 3D MRI scans by means of freesurfer 5.3, specifically volumes of hippocampus, middle temporal cortex, fusiform gyrus, entorhinal cortex, precuneus, accumbens area, insula, amygdala, caudate, pallidum, putamen, thalamus and ventricles were considered.
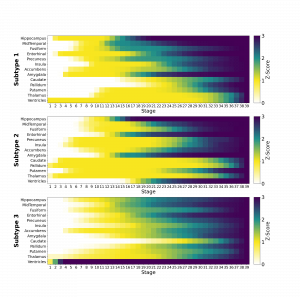
The SuStaIn disease model accounted for three disease subtypes (Fig.1). The first disease subtype (Subtype 1) represented the expected atrophy pattern for AD. It is characterized by an initial atrophy (Z-score = 1) that of the ventricles then progressesing to hippocampus and entorhinal cortex, that are also the first regions to show full abnormality (Z-score = 3) alongside amygdala. The second disease subtype (Subtype 2) shows an atrophy pattern where abnormality starts in thalamus and pallidum (Z-score = 1) and then spreads to caudate, putamen, insula, precuneus towards the inner regions of the temporal cortex. In this subtype, ventricles and hippocampus start shrinking later with respect to Subtype 1. The third subtype (Subtype 3) shows an atrophy pattern where ventricles become fully abnormal before atrophy starts in almost all the other regions, for which a fuzzier, concomitant and faster atrophic progression is manifested in comparison to the other two Groups.
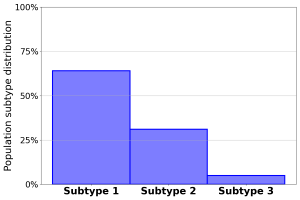
The majority of subjects were assigned to Subtype 1 (Fig.2). A significant part of the ramaining subjects were assigned to Subtype 2, while a limited number of subjects were assigned to Subtype 3. The three groups were mostly homogeneous in terms of genetic and demographic factors, with the exception of Subtype 2 which exhibited a larger share of male subjects with an higher average level of education.